DEBRA HANSEN – Associate Professor and County Director, WSU Stevens County Extension
JO ANN WARNER – Associate Director, Western Extension Risk Management Education Center
REBECCA SERO, Ph.D. – Evaluation Specialist, Washington State University Extension
Applying for and receiving an Extension Risk Management Education (ERME) grant means that you will be asked to align your program and goals with the funder’s (ERME) goals using a Performance Measure/Theory of Change approach. This will require you to develop and deploy an outcome-based evaluation and impact reporting plan with the end goal of answering the question “How and why did your work make a difference towards helping farmers and ranchers achieve their risk management goals?” There are several methods and tools you can use for your evaluation approach; in this article we will describe the benefits, walk you through the steps, and share an ERME program example of how to use Ripple Effects Mapping (REM) in your plan. This tool is especially valuable to tease out the holistic impacts that your producers have on their own operations and the communities they live in. We have compiled and condensed the process and theory that can be applied to your ERME project from A Field Guide to Ripple Effects Mapping. The guide provides details and case studies and can be found at: z.umn.edu/REMbook (Chazdon, Emery, Hansen, Higgins, & Sero, 2017).
REM is a creative, participatory evaluation technique to discover expected and unexpected outcomes of your work. It is a useful tool to use when total program impact may be difficult to conceptualize and measure with other evaluation methods. In a Performance Measure process, this qualitative approach can be used as part of a mixed methods evaluation strategy, as it can complement and ground truth quantitative methods. Information gathered during a REM session, can be shared with funders, partners, and decision makers (Kalambokidis, Hinz & Chazdon, 2015). The flexibility of the tool enables you to use it in a formative mid-program and/or summative post-program way (Hansen, Sero & Higgins, 2018).
The benefits using REM are wide-ranging and include the following: it is a participatory and appreciative approach that engages stakeholders; it can achieve group validation of results; activities can be connected to a larger purpose for participants to see emerging patterns and trends; it provides an opportunity for reflection, growth and celebration; participants are often more positive and hopeful when they see what they have accomplished; and it is adaptable to a wide-range of ages, cultures, communities and content areas. One of the most powerful aspects of using Ripple Effects Mapping as an evaluation tool is that it enables the gathering of detailed stories from a group or program that can be quantitatively and qualitatively analyzed; and it has worked successfully with farmers and ranchers as described in a Utah ERME project (see Example section). It is especially valuable in Native cultures, as storytelling and sharing of information is an excellent way to both acknowledge and empower producers.
Building REM into your Evaluation Plan
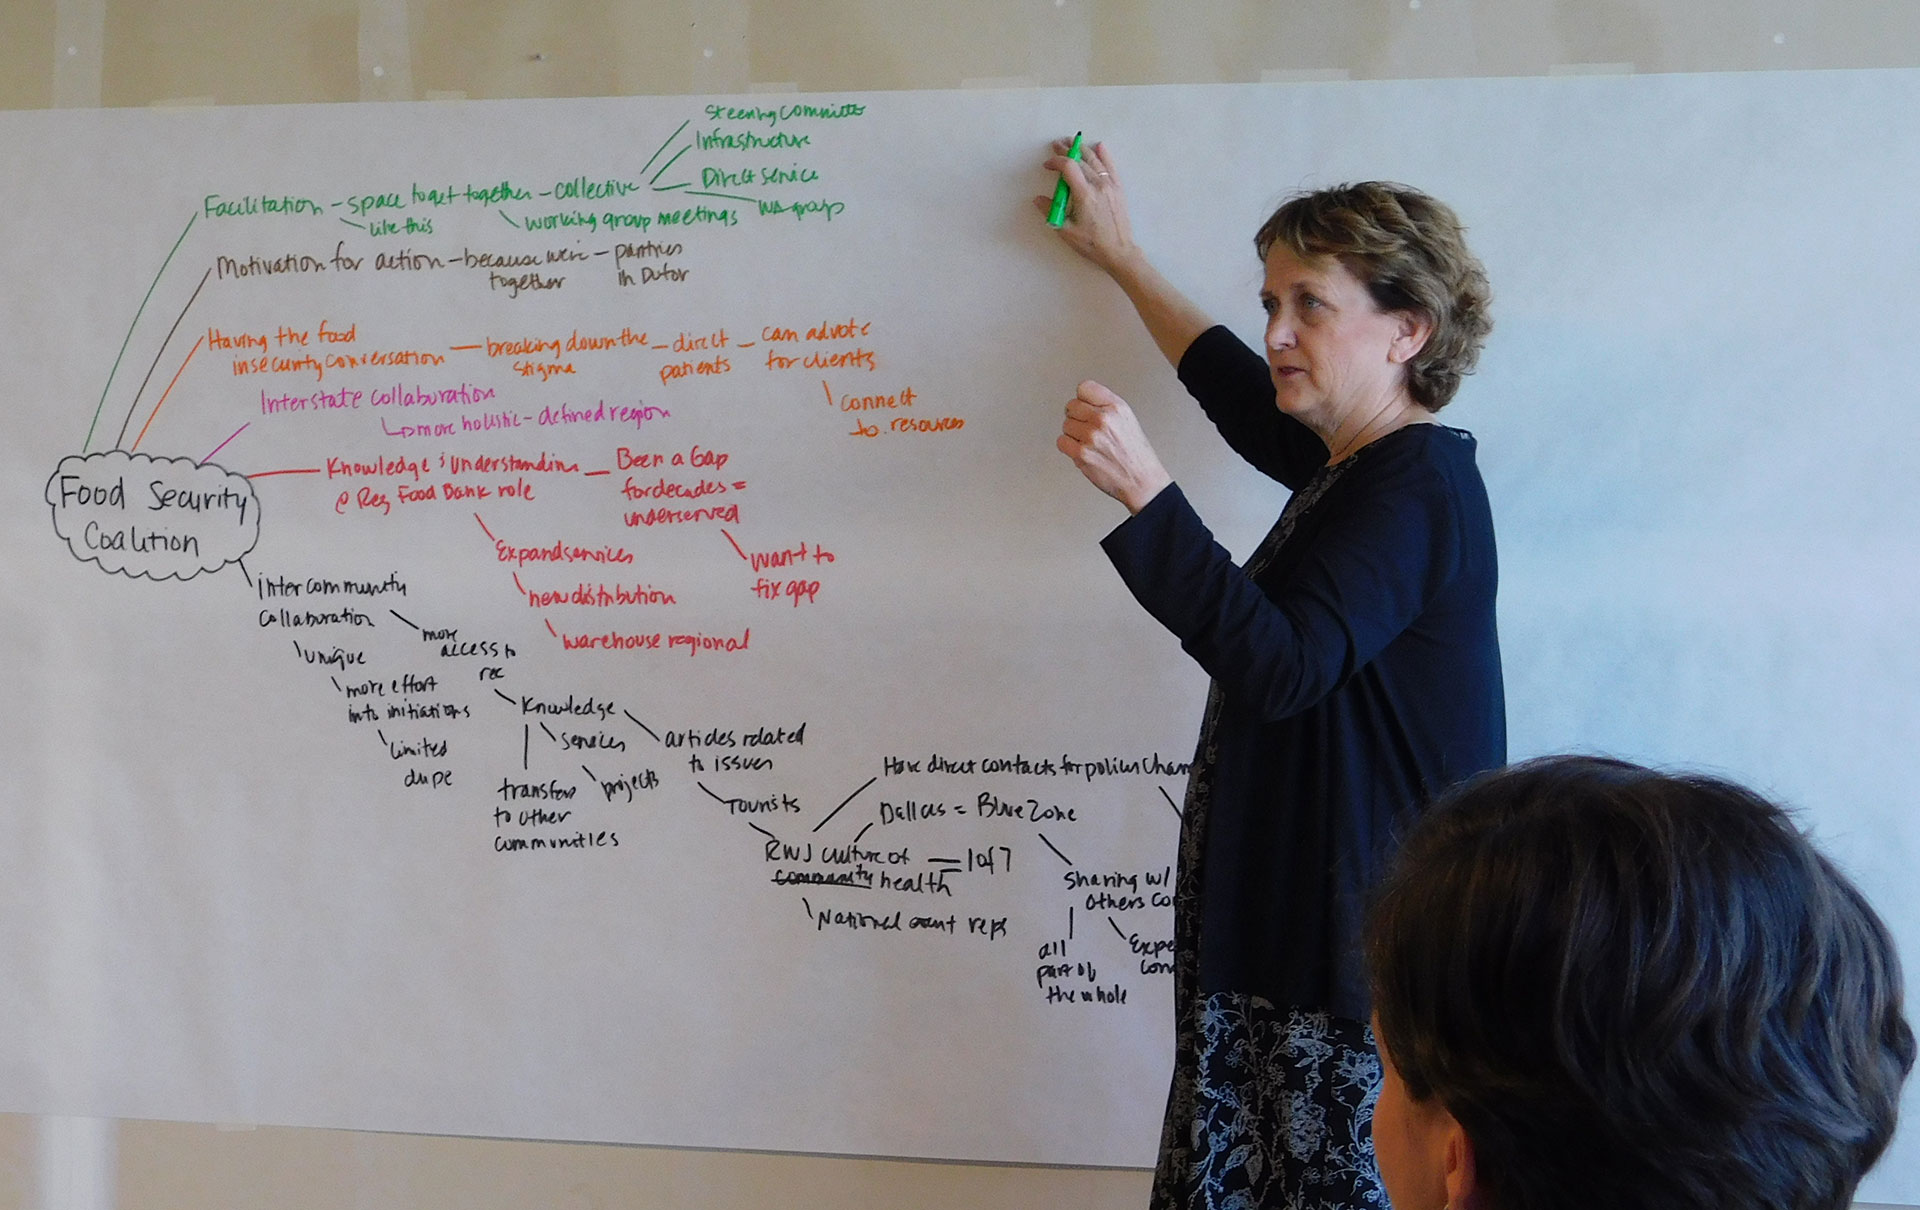
As you design your evaluation methods and determine the tools most appropriate for your program, adding Ripple Effects Mapping (REM) as one technique could enhance the qualitative data gathering aspect. This multi-step process is used to engage participants in an evaluation. It starts with Appreciative Inquiry questions to guide participants in telling their stories of success. A facilitator then brings the group back together in a focus group setting and writes these accomplishments on a large piece of paper. Through the use of a mind-mapping technique, partnerships, unique contributions and outcomes start visually appearing in front of the group. These stories then build on each other as participants interact and add details, insights and interconnections. (Hansen, Sero & Higgins, 2018).
Another benefit of REM is it can be conducted mid-program with your participants – as part of a formative evaluation plan – to see if the program design is meeting its goals or if the direction needs to be corrected. ERME grant recipients are encouraged to engage in Performance Monitoring to measure how well they are executing the program and their accountability toward participants (Sero & Warner, 2017). Ripple Effects Mapping can be used with your program participants to: a) see if your program delivery is on track with the program you designed, allowing the opportunity for you to make small incremental changes; and b) to see if there are any unexpected outcomes that could strengthen farmers and ranchers risk bearing capacity moving forward. This tool can help you demonstrate and document the value of adjusting your work plan to fit the needs of the participants and can be used to monitor, design and evaluate.
Linking REM to Performance Measures and the Theory of Change
Your program’s Theory of Change should be developed with the intent to explain the underlying assumptions for how your project activities will lead farmers and ranchers to the desired results. Conducting REM mid-program can help you collect stories and data to focus on the particular activities that are leading toward your desired outcomes and allow time for you to incrementally adjust those activities to drive toward a more successful program.
The act of using open ended questions and prompts as described on page 6 of the Evaluation Resource Materials Compilation (pdf), and mapping it out as described, will give you specifics on whether the project is meeting your objectives for the participants. Review the rationale for your Theory of Change (ToC), which is the foundation for a performance measure approach. This will help you to determine the best questions and prompts tied to a specific part of your multiple program interventions while keeping the end goal in mind. For example, you might want to know how your current activities are making a difference in yield rates for your producers. The questions you ask would be focused on drawing this out. The collected data will evaluate your progress “toward the stated goals as well as the effectiveness of interventions in producing outcomes,” (Taplin & Clark, 2012).
Core Ingredients and Steps
REM is an emerging approach and can be adapted and refined based on the program or evaluation context. Whether you are using REM as a mid-term program or end evaluation, there are four core elements imperative to the success of the evaluation approach as shown in the following list.
Core ingredients to Ripple Effects Mapping
- Appreciative Inquiry: This positive approach helps to focus participants on program successes by having them spend time discussing several guiding questions in pairs before creating the ripple map. Brainstorming success stories in pairs elicits a multitude of outcomes and allows everyone time to reflect on program activities. (Emery, Higgins, Chazdon, & Hansen, 2015).
- A participatory approach: All participants of the program including providers, partners, beneficiaries, and any other interested parties are invited to be actively involved.
- Peer-to-peer interactive interviewing and group reflections: Interactive interviews allow for every participant’s story to be part of the conversation, even if they choose not to “report out” during the mind mapping stage and have their interview partner discuss their experience. Group reflection provides an opportunity for the whole group to reflect on the effects of the program as well as how the effects are connected with one another.
- Radiant thinking (mind mapping): An interactive way to visually show the chain of events resulting from a program. It gives participants who are visual learners an opportunity to view the big picture and specific details at the same time.
Ripple Effects Mapping: In-depth Rippling Steps
The following sections provide the process steps to conduct Ripple Effects Mapping using the In-depth method, which can be adapted for ERME projects.
Step 1: Appreciative Inquiry conversations
At the beginning of the REM event, participants are paired up and instructed to interview each other about particular ways the program affected their lives or particular achievements or successes they have experienced as a result of the program (for more information on the role of Appreciative Inquiry in REM, see The Core Ingredients of REM chapter, Chazdon et. al., 2017). These positive-framed conversations guide participants in telling their stories of success in pairs using the following types of questions:
As a result of participating in this program…
- What action steps have you taken?
- What changes are you most proud of?
- What changes have made the greatest financial and overall impacts to your farm or ranch operation?
- Have you shared your knowledge with others?
Step 2: Ripple Effects Mapping on the wall
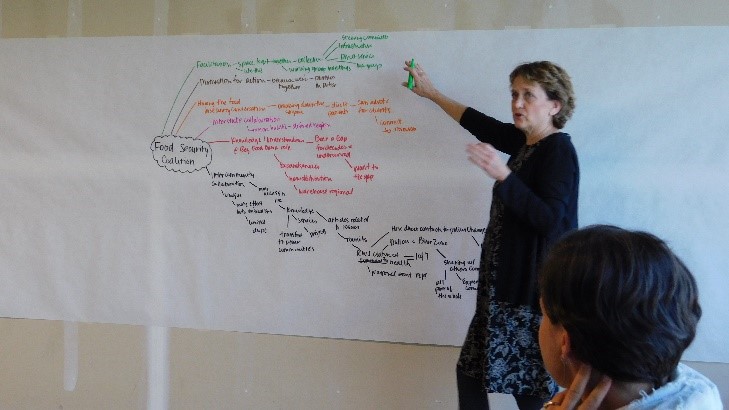
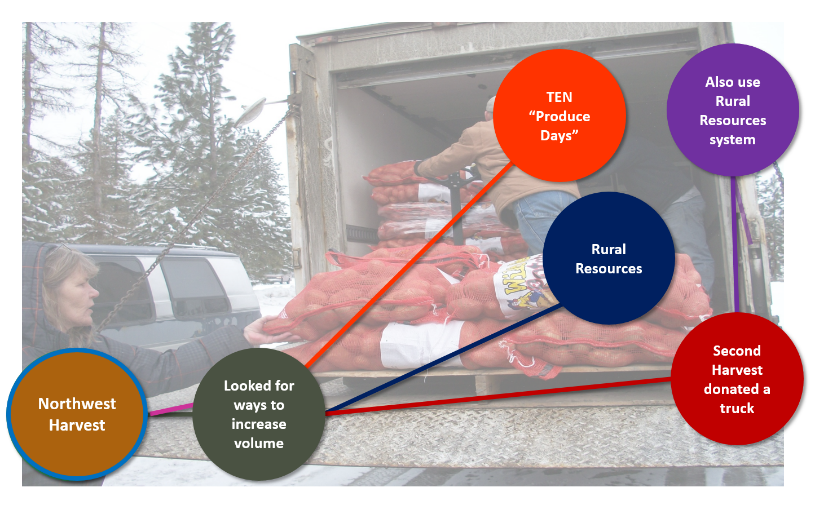
The core portion of the session involves group mapping using butcher block paper and tape on a wall to brainstorm and hierarchically map the effects or “ripples” of the intervention. This process engages the entire group and provides opportunities for participants to make connections among program effects. The process is co-led by a facilitator and a “mapper” and is typically completed in one to two hours.
In a focus group setting, a facilitator writes participant accomplishments on a large piece of paper. Their stories build on each other as participants interact and add details, insights and interconnections. Using a mind-mapping technique, outcomes, unique contributions and partnerships start visually appearing in front of the group. The display of program and participant results reveals multiple ripples and clusters of positive feedback to the project team and participants.
The long-term outcomes as determined by your Theory of Change can be teased out with the specific prompts that you use in the mind-mapping phase of the exercise. For example, if you are measuring the benefits of farm planning like the ERME example, you could prompt ripples by asking “How did this program positively impact your ranch operation?”
Step 3: Digitizing to Software – Organize for Coding and Print for Sharing
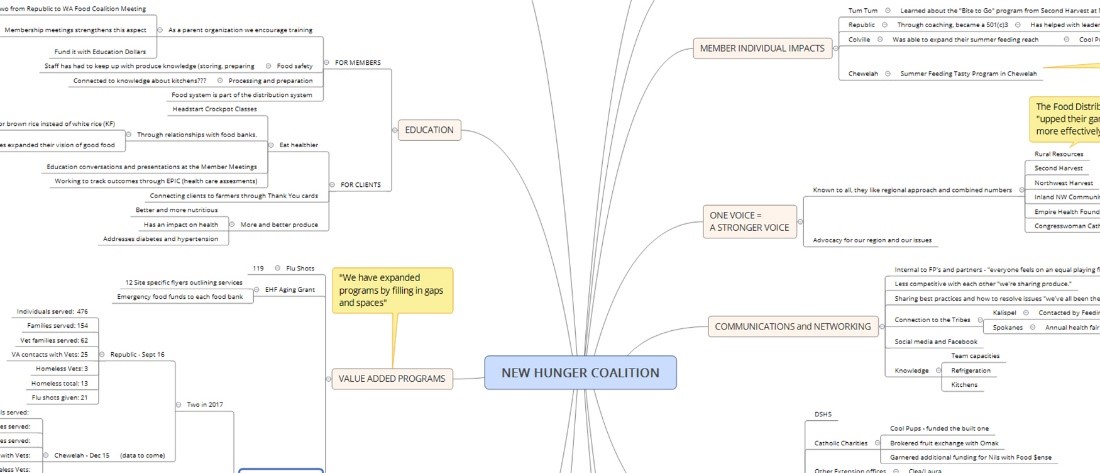
Mapping data is digitized into software (we use Xmind.net) and can show expanded clusters of activity – demonstrating to participants where the accomplishments from their activities were most apparent. This can be a topic of discussion when presenting the results back to participants. The map can be shared in a pdf format with participants, funders, partners and other stakeholders.
Step 4: Export and Code the Qualitative Data
After the session, the evaluator may need to reorganize the mind map and collect additional detail by interviewing other participants and stakeholders. The data produced in the mapping process can be downloaded into a spreadsheet program and coded in a variety of ways. For example, the “ripples” can be coded as short-term knowledge, skill, or attitude changes; medium-term behavior changes; and long-term changes in conditions. Furthermore, these changes in conditions can be coded using the Community Capitals Framework (Emery & Flora, 2006). Table 1 shows REM results from a business, retention and expansion (BRE) program in four Minnesota communities with the greatest number of effects in human and social capital, out of seven community capitals (Darger, 2013).
Table 1. Community Capital “effects” found in a Minnesota BRE program using a REM exercise.
| Hugo | Monticello | Lyon County/ Marshall |
Forest Lake | Average | |
|---|---|---|---|---|---|
| Human | 61 | 85 | 82 | 26 | 63.5 |
| Social | 29 | 52 | 47 | 28 | 39 |
| Civic | 49 | 24 | 53 | 17 | 35.8 |
| Built | 17 | 13 | 9 | 22 | 15.3 |
| Financial | 27 | 2 | 3 | 2 | 8.5 |
| Natural | 2 | 0 | 0 | 6 | 2 |
| Cultural | 2 | 0 | 0 | 2 | 1 |
Note: Percentages add to more than 100%
What can you do with the information?
One of the most powerful aspects of using Ripple Effects Mapping as an evaluation tool is that it enables you to gather detailed stories from a group or program. As you report your findings to funders, program participants, and other stakeholders, it is highly recommended that you take advantage of this rich and comprehensive data. The data collected can be used to report your outcomes to Extension Risk Management Education (which ERME reports to NIFA); as well as report the public value aspects of your project back to your producers, and local, regional and other pertinent stakeholders.
Extension Risk Management Education (ERME) Example
To understand how it might be applied to a risk management framework, a case of Ripple Effects Mapping is highlighted in an ERME project success story: “Managing Financial Risks in South Central Utah.” Project Director Jay Olsen from Snow College used a mixed method evaluation strategy throughout the seven-year duration of his ERME funding; including financial analysis, participant surveys and focus groups. Last year he used REM for the first time and states, “It brought forward impacts otherwise unrecognized by the project delivery team and participants alike.” For instance, a family ranch operation started up a grass-fed beef enterprise, and switched to custom grazing. Each of these outcomes led to respective increases in their profitability and improved family relationships.
Conclusion
Ripple Effects Mapping links the process of gathering stories with qualitative and quantitative data to result in accountability and transparency in reporting producer outcomes. It is especially useful in teasing out the elusive unexpected outcomes that benefit farmers and ranchers and the communities they live in. It is not only an evidence-based tool, but also relies upon participant collaboration by creating an environment of trust, which can also effectively contribute to your overall program development within the community. Viewing REM through the lens of the ERME program, shows that it can help to fulfill ERME’s goal of improved economic viability for farmers and ranchers and can contribute positively to the return on investment of ERME/NIFA funds. The combination of stories and data can validate both the expected and unexpected outcomes, which meet your reporting obligations to ERME; with demonstrated achievement of producer outcomes and program success in a format that is easily available to all stakeholder partners. Share this information with your constituents as evidence that your program, and participant outcomes and impacts are a worthwhile investment of taxpayer dollars.
Your Performance Measures and Theory of Change outline how your work will ultimately improve producer results for farmers and ranchers within the community. REM aligns well with the Performance Measure/Theory of Change construct as it is a tool that can effectively map the relationship between your program effort and the desired results/outcomes for producers. Using it as a formative evaluation tool will enable you to collect important data during the implementation of your program. As a summative evaluation tool, REM allows you to demonstrate how your programmatic work had an impact on producers. The strength in Ripple Effects Mapping exists within its flexibility to be used (1) throughout the project with (2) a diverse group of individuals by using (3) storytelling to (4) demonstrate the economic, societal, and public impact of your work.
Resources:
Chazdon, S., Emery, M., Hansen, D., Higgins, L., & Sero, R. (2017). A field guide to Ripple Effects Mapping. Minneapolis, MN: University Libraries Publishing. Retrieved from: z.umn.edu/REMbook.
Darger, M (2014). Capturing the Ripples from Community-Driven Business Retention and Expansion Programs. Journal of Extension, 52(2). Article 2TOT6.
Hansen, D., Sero, R. and Higgins, L. (2018). Ripple Effects Mapping: Collecting Impacts in an Engaging and Participatory Way. International Association of Community Development Practice Insights Magazine, 10.
Kalambokidis, L., Hinz, L. & Chazdon, S. (2015). Using economic principles to show how Extension programs create public value. In J.M. Bryson, B.C. Crosby, & L. Bloomberg (Eds.), Creating Public Value in Practice (pp. 311-329). Boca Raton, FL: CRC Press.
Olson, J. (2017). Acquiring benchmarking skills for beginning and progressing farmers and ranchers.
Sero, R., and Warner, J. (2017). Documenting Success Through Performance Measures.
Sero, R. WSU Extension Project & Program Evaluation
Taplin, D. & Clark, H. (2012). Theory of change basics: A primer on theory of change (pdf). ActKnowledge.