Presented: June 6, 2019
| Contact | Phone | |
|---|---|---|
| Shannon Neibergs | sneibergs@wsu.edu | 509-335-6360 |
| Aaron Esser | aarons@wsu.edu | 509-659-3210 |
| Randy Fortenbery | r.fortenbery@wsu.edu | 509-335-7637 |
Timeline
- The Agriculture Improvement Act of 2018 passed Congress and became law in December 2018
- Its passage was followed by the longest government shut down in history delaying the rule making process
- August 1, 2019 is the estimated date for final rules and regulations publication in the Federal Register
- The announced sign-up opening date for commodity programs is September 1, 2019
- No ending date for sign-up has yet been announced
Projected Outlays, FY2019-2029
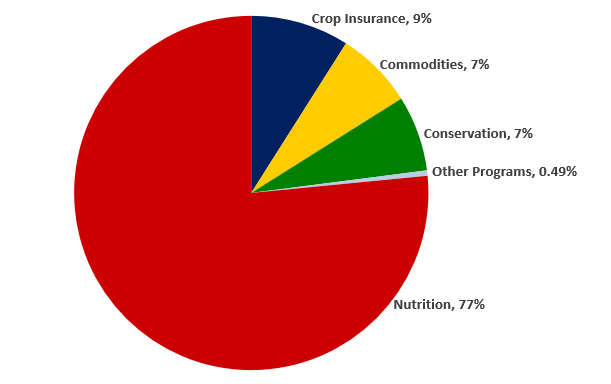
- Data for the Projected Outlays pie chart
-
- Nutrition: 77%
- Crop Insurance: 9%
- Commodities: 7%
- Conservation: 7%
- Other Programs: 0.49%
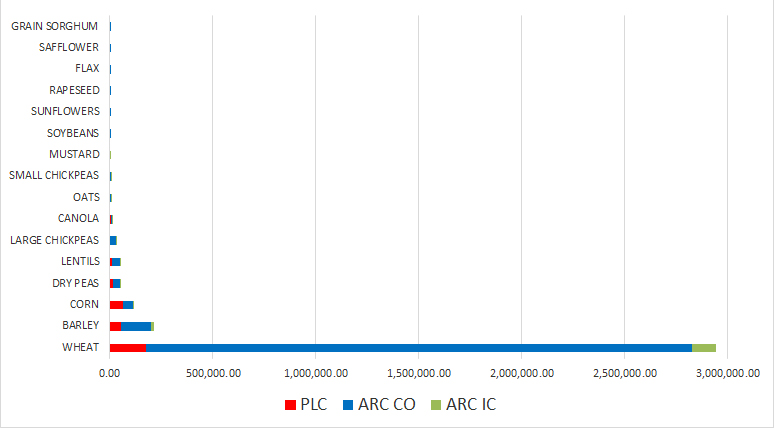
2014 Base Acres and Commodity Programs
Washington Base Acres by Program Enrollment
- Data for Washington Base Acres by Program Enrollment chart
-
Crop PLC ARC ARC-IC WHEAT 177408.9 2653125 116262.3 BARLEY 55675.89 145371.1 15245.05 CORN 63804.67 48011.72 1112.91 DRY PEAS 12662.11 36530.97 5645.76 LENTILS 11116.1 35400.82 2713.31 LARGE CHICKPEAS 2706.81 26078.86 6144.59 CANOLA 5345.02 2482.23 146.85 OATS 1815.53 3777.41 66.37 SMALL CHICKPEAS 713.24 2075.39 424.1 MUSTARD 165.3 1573.3 93.2 SOYBEANS 7.17 650.13 SUNFLOWERS 559.11 34.7 RAPESEED 217.18 42.89 FLAX 17.07 172.27 SAFFLOWER 101.85 42.27 GRAIN SORGHUM 25.8 17.02
Whitman County ARC CO vs PLC
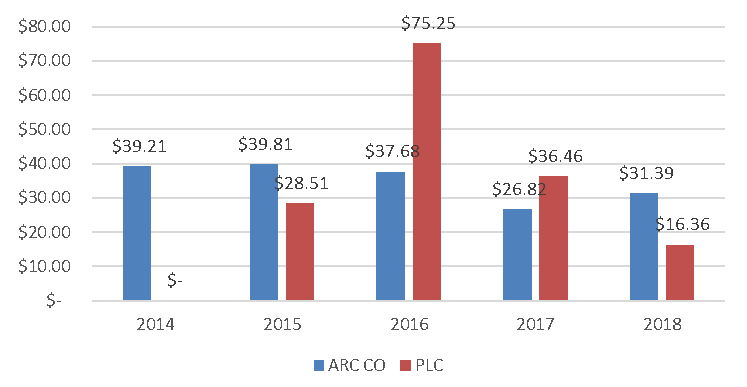
2014 to 2018 Combined
- ARC CO $174.91
- PLC $156.58
- Data for the Whitman County ARC CO vs PLC chart
-
Year ARC CO PLC 2014 $39.21 N/A 2015 $39.81 $28.51 2016 $37.68 $75.25 2017 $26.82 $36.46 2018 $31.39 $16.36
- By far wheat has the most base acres in Washington with 2.95 million acres
- 90% of wheat base is in ARC CO, 6% in PLC and 4% in ARC IC
- ARC CO payments were large in 2014 -2015. PLC largest in 2016
- Each county is unique. For Whitman ARC CO paid more. In Columbia PLC paid more
- 2018 Farm Bill reduces selection risk
- Initial sign-up for 2019 and 2020, and then annually for 2021 to 2023
Columbia County ARC CO vs PLC
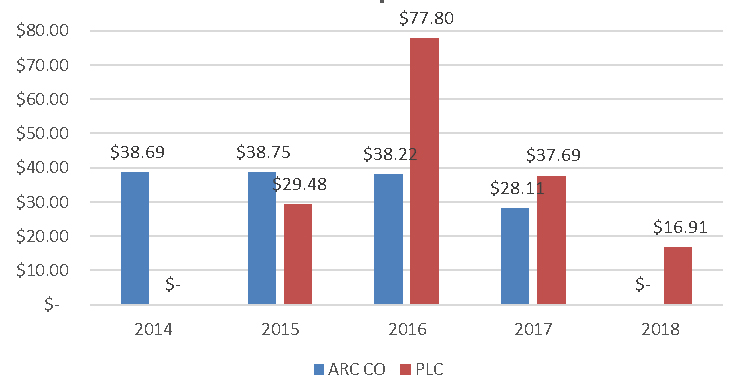
2014 to 2018 Combined
- ARC CO $143.76
- PLC $161.89
- Data for the Columbia County ARC CO vs PLC chart
-
Year ARC CO PLC 2014 $38.69 N/A 2015 $38.75 $39.48 2016 $38.22 $77.80 2017 $28.11 $37.69 2018 N/A $16.91
PLC and ARC CO Payment Formulas
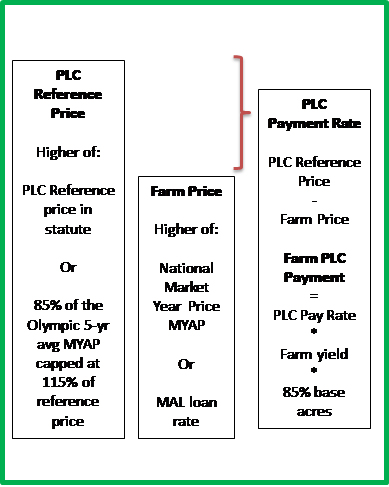
PLC
- Detailed description of PLC Payment Formula chart
-
PLC price protection is based on a statutorily fixed reference price. PLC makes a payment when the MYAP is less than the effective reference price. The PLC payment rate equals the difference between the effective PLC reference price and the higher of the MYAP or the MAL loan rate. The PLC payment rate times the farm’s yield determines the per-acre payment rate. The PLC payment rate times 85% of base acres signed up for the respective covered commodity equals the total payment.
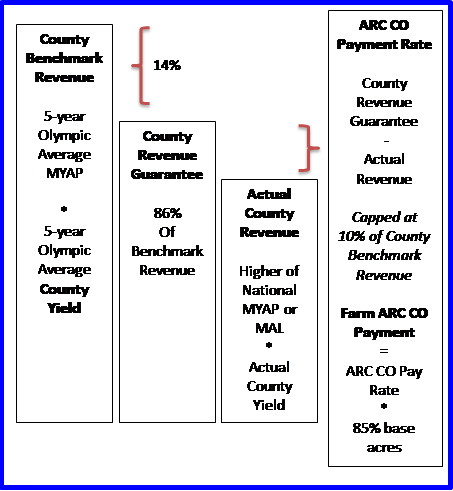
ARC CO
- Detailed Description of ARC CO Payment Formula chart
-
The ARC-CO crop revenue guarantee equals 86% of the county benchmark revenue. The benchmark revenue is the product of the five-year Olympic Average of county yields and the five-year Olympic average of national MYAPs. The ARC CO payment rate is the county revenue guarantee minus the county actual revenue in the year being analyzed. The ARC CO payment is capped at 10% of county benchmark revenue. The ARC CO payment rate times 85% of base acres equals the total payment.
- PLC and ARC CO payment formulas remain the same from 2014 Farm Bill
- But, yield data used in ARC CO changes from using NASS data to RMA yield data
- A map study shows most of Washington RMA wheat yields to be slightly less than NASS yields
- National Farm Bill decision aids will be updated and use RMA yields for sign-up analysis
- 2018 Farm Bill introduced a reference price escalator for PLC
- Preliminary estimates indicate that large chickpeas, rapeseed, lentils, and small chickpeas will have higher reference prices due to the escalator in 2019
Declining Trend in ARC CO Revenue
Wheat Olympic Average Price
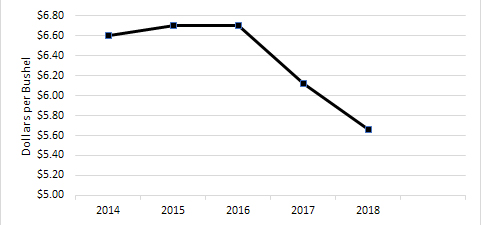
5-yr Olympic Average Wheat Price
- Data for the Wheat Olympic Average Price Data chart
-
Year Price per bushel 2014 $6.60 2015 $6.70 2016 $6.70 2017 $6.12 2018 $5.66
- 5 year Olympic average prices have a declining trend
- Declining prices reduce ARC CO county benchmark revenue
- ARC CO formula further reduces revenue guarantee 14%
- Analyst predict that more producers will sign-up for PLC
- PLC uses FSA farm yield.
- Farms with FSA yields > county average yield benefit with PLC
- Yield update is available with 2019 sign-up
- Farms need to use the national Farm Bill Decision aids when available to evaluate their farm’s unique attributes for yield update and program choice at sign-up